Cart On Ramp Lab
Ibrahim Khan, Merrelle Grillo, and Emmy Xu
September 23, 2021
September 23, 2021
How does time affect the velocity of the Cart?
Variables
Independent: Time
Dependent: Velocity
Controls: Slope of surface, cart, initial position
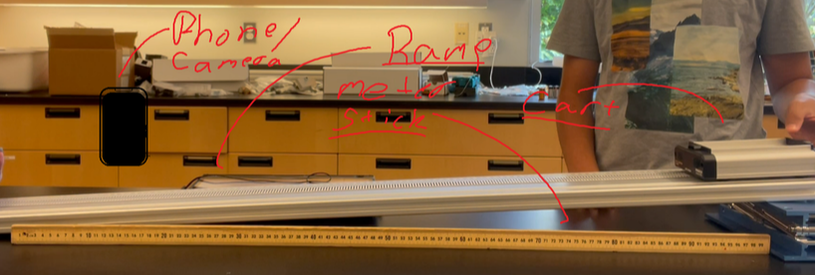
To collect data, we used a single trial and measured the data using logger pro by inputting a video of the cart's motion on the ramp with a visible meter stick next to it in order to keep things at scale. To record our video, we kept the camera in a position that it wouldn't move so we could get a fair result. We then lined up our measuring stick with the ramp and let the buggy go from the top of the ramp. After recording our data, we inserted the video into LoggerPro where we broke it down to create graphs and find data points to find our velocity and acceleration.
Independent: Time
Dependent: Velocity
Controls: Slope of surface, cart, initial position
To collect data, we used a single trial and measured the data using logger pro by inputting a video of the cart's motion on the ramp with a visible meter stick next to it in order to keep things at scale. To record our video, we kept the camera in a position that it wouldn't move so we could get a fair result. We then lined up our measuring stick with the ramp and let the buggy go from the top of the ramp. After recording our data, we inserted the video into LoggerPro where we broke it down to create graphs and find data points to find our velocity and acceleration.
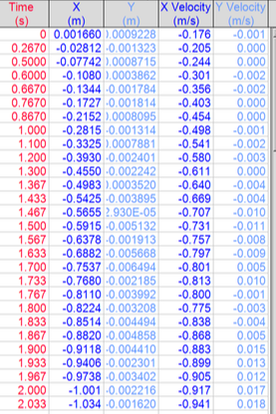
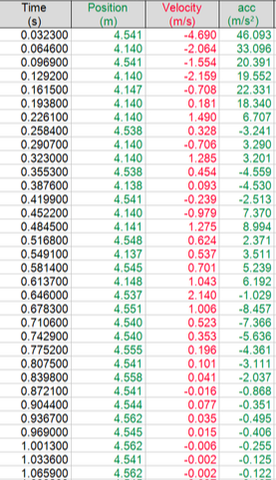
Unprocessed Data Processed Data
|
|
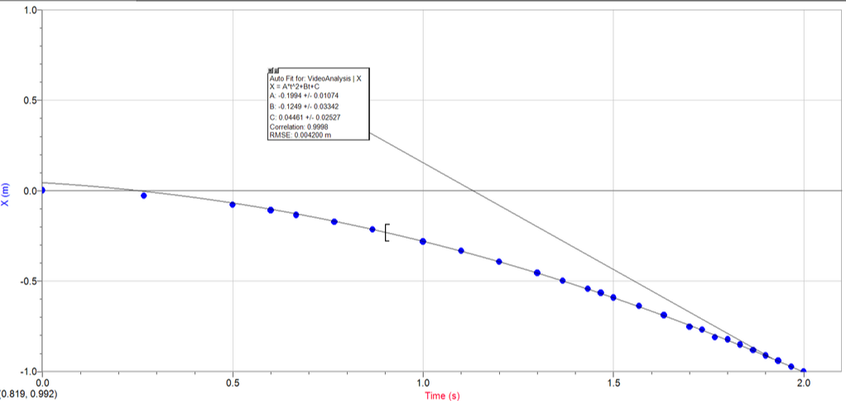
This velocity time graph depicts out velocity as it increases while going down the ramp. The equation represented in this graph is:
x=-0.019t^2-0.125t+0.045
x=-0.019t^2-0.125t+0.045
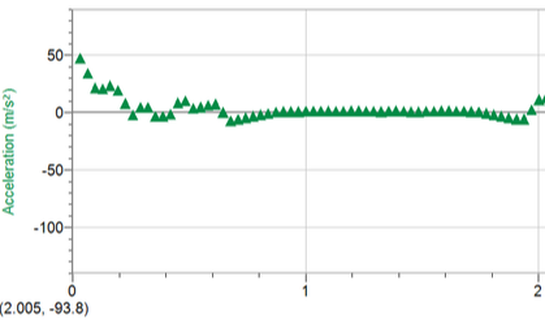
This is a velocity time graph. The graph is slightly flawed due to uneven data and time. However from about 0.9 seconds to 2 seconds, we can see the correct depiction of velocity-time.
Time (seconds)
Conclusion
In this lab, we saw how the velocity of the cart was affected by time as well as the slope of the ramp. We can use this same method to find the velocity of any object going down an incline. We also learned the formulas to calculate velocity and speed with position and time. We found the initial velocity of the cart to be 0.125 m/s and the acceleration of the cart to be 199 m/s/s. This data was pretty accurate for the most part because we used LoggerPro which cant really make human errors in calculations or other aspects. However, because it is a computer, it needs human input which can be flawed. If I were to change any part of this lab it would be to also graph the information manually and to derive specific data points by hand in order to check and learn how to do it without a computer.
Buggy Lab
Ibrahim Khan, Curtis Zhou, and Ryan Rong
September 13, 2021
September 13, 2021
How Does Time Affect The Position of the Buggy?
Variables
Independent: Time
Dependent: Position
Controls: Surface, Buggy, Initial Position,
Experimental Process: Measuring the change in position in a set amount of time on many intervals with multiple trials
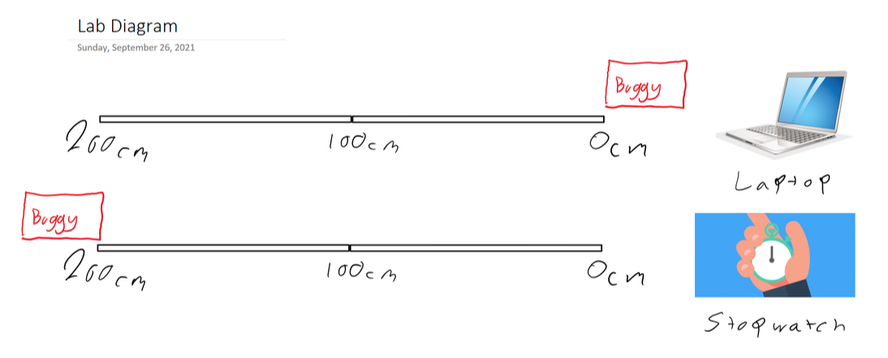
We first chose 5 time intervals that we would test the buggy with. We put the buggy at the starting point and let it run for 1 second. Then 2 seconds, 5 seconds, 10 seconds, and finally 15 seconds. We stopped it at the time and noted the position in terms of centimeters from the initial position. We then ran 3 trials for each one. We recorded the data in a table which we then converted into a position-time graph. After starting from 0 and running it forward, we ran it from 200 and ran it backwards conducting the same steps.
Independent: Time
Dependent: Position
Controls: Surface, Buggy, Initial Position,
Experimental Process: Measuring the change in position in a set amount of time on many intervals with multiple trials
We first chose 5 time intervals that we would test the buggy with. We put the buggy at the starting point and let it run for 1 second. Then 2 seconds, 5 seconds, 10 seconds, and finally 15 seconds. We stopped it at the time and noted the position in terms of centimeters from the initial position. We then ran 3 trials for each one. We recorded the data in a table which we then converted into a position-time graph. After starting from 0 and running it forward, we ran it from 200 and ran it backwards conducting the same steps.
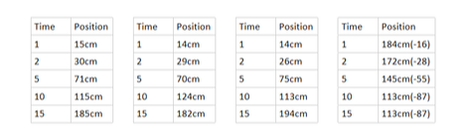
Raw Data
Processed Data
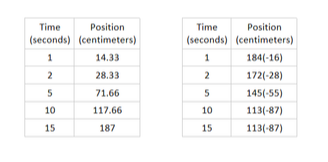
We averaged the positions for the first table
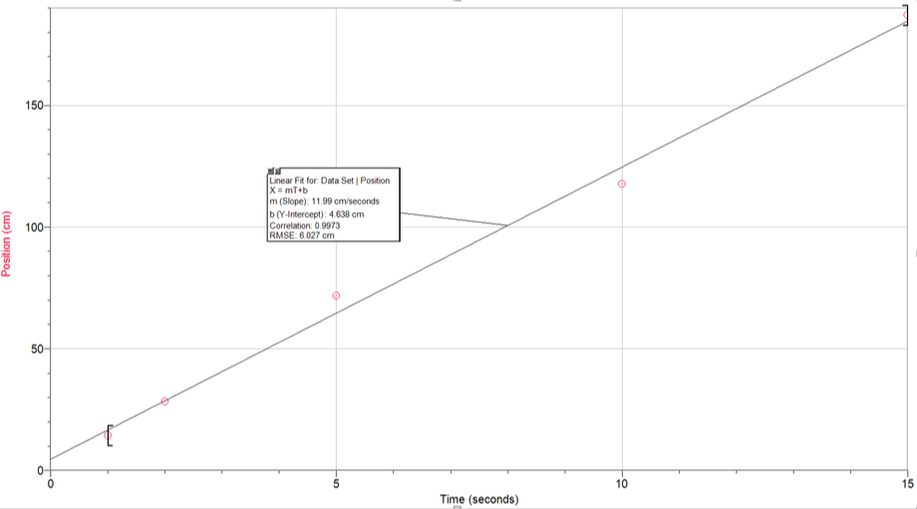
The equation for this graph would be:
x=11.99t+4.638
In this graph the slope represents the velocity of the buggy and the y-intercept represents the initial position of the buggy. The y-intercept isn't 100% accurate due to human error.
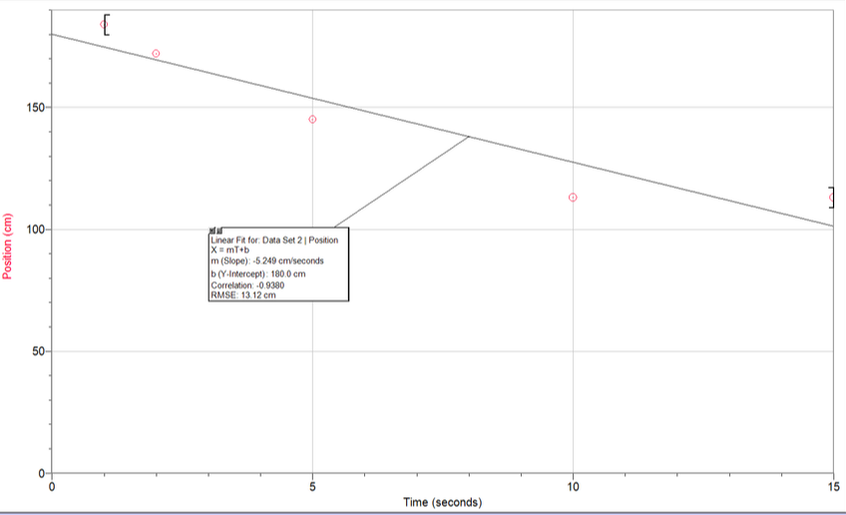
The equation represented by this graph is:
x=-5.25t+180
In this graph the slope represents the velocity of the buggy and the y-intercept represents the initial position of the buggy. The y-intercept isn't 100% accurate due to human error.
Another error in this data set comes from an inconsistency in our control. The buggy slowed down due to loss of power for the last few trials which gave us a less steep slope and the same positions for two different times.
Conclusion
The purpose of this lab was to find the velocity of the buggy through change in position based on time. We found that our most accurate velocity for the buggy was 11.99m/s. The buggies velocity remained constant through every run which is reflected on the graph through the linear equation and straight line. There were some inconstancies most of which were caused by human error in reflexes which caused non-zero y-intercepts. The buggies weak battery also skewed our data especially for the second data set.
This lab required a lot of human work which makes room for human error. Inconsistencies in calling the time and stopping the buggy definitely affected our final results. Many, many trials could help resolve this challenge in order to make it as accurate as possible.
This lab required a lot of human work which makes room for human error. Inconsistencies in calling the time and stopping the buggy definitely affected our final results. Many, many trials could help resolve this challenge in order to make it as accurate as possible.
