Unit 1 - Kinematics
The study of objects in motion without forces
Terminology:
Distance -- A scalar which shows how much an object has moved in total from beginning to end
Position -- A vector which represents the place where something is at a given time
Displacement -- A vector which represents the shortest distance from the initial position to the final position
Distance -- A scalar which shows how much an object has moved in total from beginning to end
Position -- A vector which represents the place where something is at a given time
Displacement -- A vector which represents the shortest distance from the initial position to the final position
|
Interpreting Position-Time Graphs
A position-time graph shows position along the y-axis and time along the x-axis. It can be used to find velocity and position at given times. The slope of the graph represents the objects velocity and the y-intercept is its initial position. To find velocity or speed, you would find the change in position per second which would also be equivalent to the slope. 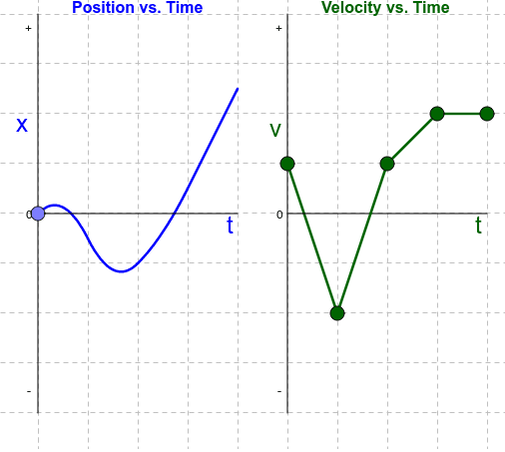
|
Interpreting Velocity-Time Graphs
A velocity-time graph shows velocity along the y-axis and time on the x-axis. This type of graph can be used to find the velocity of an object a a certain time as well as to find the acceleration of an object. The y-intercept on this graph represents the initial velocity for an object while the slope indicates the acceleration which can be found by finding the change in acceleration per second or the change in position per seconds². In order to find position from this graph, you need to have the initial position. Then you can find the the change in position from the area between the line and x-axis and add it to the initial position in order to get a position for a specific time. To solve for distance, you have to solve for the area between the line and x-axis which gives you the change in position or distance. In order to calculate displacement, you must note your distance at every change in acceleration (slope) and combine it to get your total displacement. |
|
Graph Connections
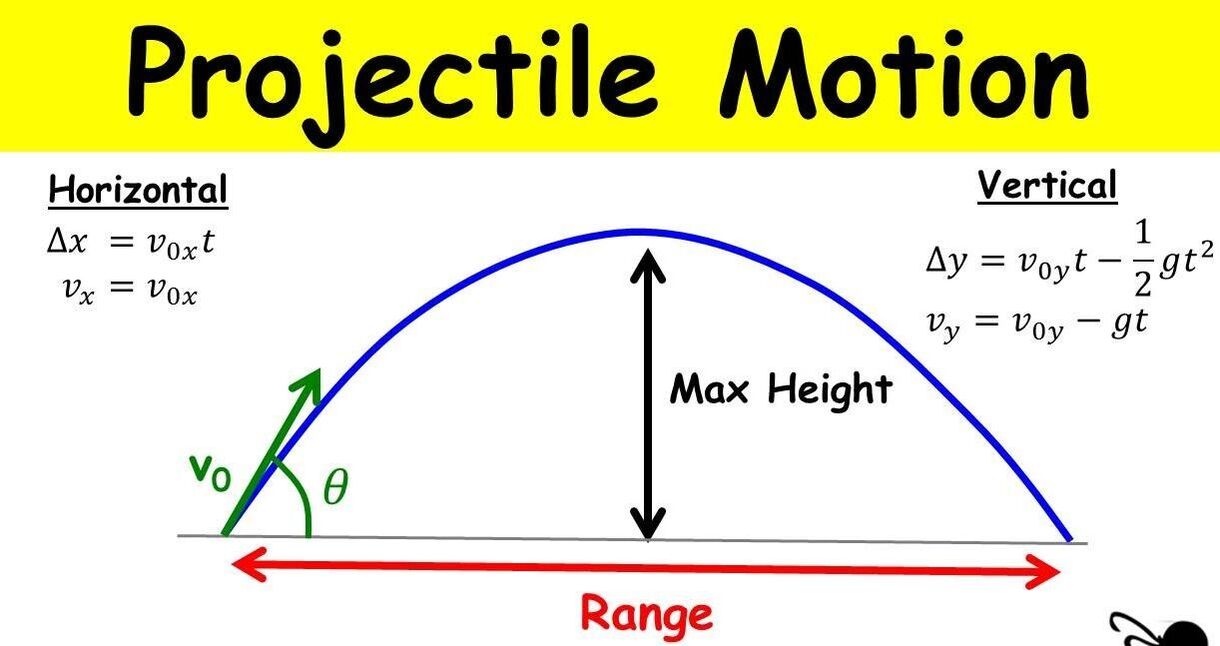
Both graphs are simple to translate to each other. When a position-time graph has a horizontal line, the velocity time graph has a horizontal line at 0. When a position-time graph has a non horizontal line, the velocity-time graph has a horizontal line not at 0. When the slope of a position-time graph is not constant, the velocity-time graph has a slanted constant line. strobe diagrams can also be used to find acceleration similarly to velocity time graphs. We also know that problems with constant velocity result in no acceleration Projectile Motion Horizontal velocity and acceleration remain constant for all projectiles. Vertical acceleration also remains constant at -9.8m/s/s. However, vertical velocity changes as it goes up and down decreasing and increasing respectively. |
|
